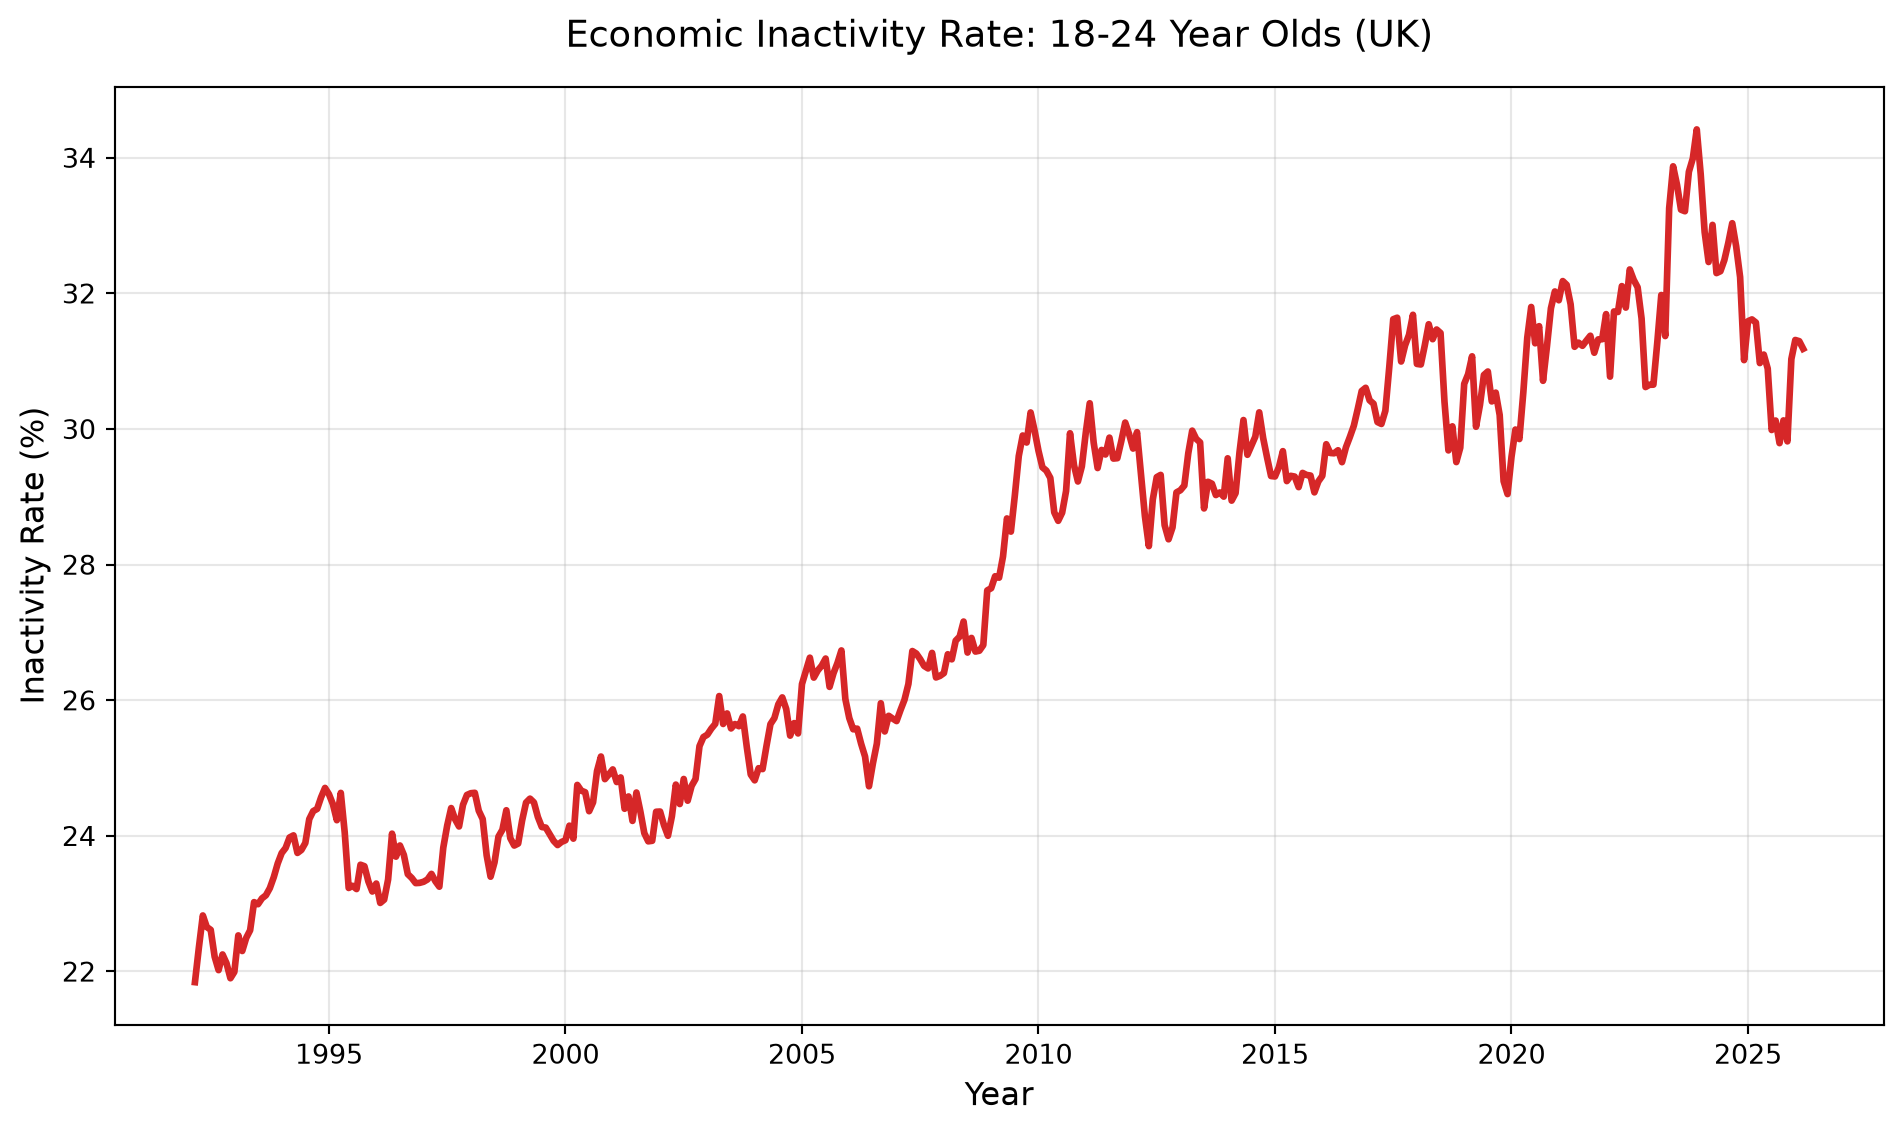
Are young people in the UK working less than previous generations? If so, what are they doing instead, and what might this mean for the future workforce?
Executive Summary: * Are Young People working less? Yes. Since 2004, the employment rate for 18–24 year olds has dropped significantly, while the economic inactivity rate has surged from ~25% to over ~32%.
What are they primarily doing with that time? -> Education & Health-Related Inactivity.
The largest portion of young adults (18–24) who are not in employment are actually in full-time education. As of early 2026, ~25.5% of the entire 18–24 demographic are economically inactive students.
However, there is a growing, structural crisis. The NEET (Not in Education, Employment, or Training) rate has risen to 15.8%. Crucially, the majority of these NEETs (9.4%) are economically inactive (not looking for work), largely driven by long-term mental and physical health conditions. Only 6.4% are actively seeking employment.
What will this mean for us all? While higher education participation delays entry into the workforce (creating a short-term labor squeeze but potentially higher long-term productivity), the rising rate of inactive, unwell NEETs presents a severe economic threat. It risks long-term “wage scarring” for a generation of young adults and a shrinking tax base coupled with higher social safety net reliance for the broader UK economy.
Data to explore
To gain a handle on the state of youth employment, I’ve used data sources from the Office of National Statistics, which help us understand the economical activity, employment rate, portions of the youth in education, and those not involved in either education nor employment.
data/A05.xls — employment / inactivity rates, broken down by sheet (People, Men, Women). Office of National Statistics
data/NEET.xlsx — rates, broken down by sheet (People - SA, Men - SA, Women - SA). [Office of National Statistics](* data/A05.xls — employment / inactivity rates, broken down by sheet (People, Men, Women). Office of National Statistics
Key Terms
Employment:
Economically active:
NEET (Not in Education, Employment or Training):
Show code
import reimport pandas as pdimport matplotlib.pyplot as pltimport plotly.graph_objects as godef extract_year(period):"""Converts an ONS string period (e.g., 'Nov-Jan 1993') into a chronological fractional year."""ifnotisinstance(period, str):returnNone month_offsets = {'Jan': 0.0, 'Feb': 1/12, 'Mar': 2/12, 'Apr': 3/12,'May': 4/12, 'Jun': 5/12, 'Jul': 6/12, 'Aug': 7/12,'Sep': 8/12, 'Oct': 9/12, 'Nov': 10/12, 'Dec': 11/12 }# 1. Prevent footnotes at the bottom of the file from being parsed start_month = period[:3]if start_month notin month_offsets:returnNone# 2. Extract a valid 4-digit year match = re.search(r'(19\d{2}|20\d{2})', period)ifnot match:returnNone yr =int(match.group(1))# 3. Fix the calendar boundary issue for Nov/Decif start_month in ['Nov', 'Dec']: yr -=1return yr + month_offsets[start_month]def find_col(df, *keywords):"""Returns the first column name in df containing every keyword given."""for c in df.columns:ifall(k in c for k in keywords):return craiseKeyError(f"No column found matching {keywords} in columns: {list(df.columns)}")
Show code
def parse_a05_sheet(filepath, sheet_name):"""Parses a sheet from the ONS A05 (employment/inactivity) dataset into a clean pandas DataFrame.""" raw = pd.read_excel(filepath, sheet_name=sheet_name, header=None)# Locate the start of the table header_start = raw.index[raw.iloc[:, 1].astype(str).str.contains("Aged 16 and over", na=False)][0]# Four header rows age_row = raw.iloc[header_start] measure_row = raw.iloc[header_start +1] stat_row = raw.iloc[header_start +2] code_row = raw.iloc[header_start +3]# Data starts after the blank row data_start = header_start +5 df = raw.iloc[data_start:].reset_index(drop=True)# Build readable column names, forward-filling the merged age/measure header cells columns = [] current_age ="" current_measure =""for age, measure, stat, code_ inzip(age_row, measure_row, stat_row, code_row):if pd.notna(age): current_age =str(age).strip()if pd.notna(measure): current_measure =str(measure).strip() parts = [ current_age, current_measure,str(stat).strip() if pd.notna(stat) else"",str(code_).strip() if pd.notna(code_) else"", ] columns.append("_".join(p for p in parts if p)) df.columns = columns df = df.rename(columns={df.columns[0]: "Period"}) df = df.dropna(how="all")# Convert numeric columns safelyfor c in df.columns[1:]: df[c] = df[c].astype(str).str.replace(",", "", regex=False).replace("nan", pd.NA) df[c] = pd.to_numeric(df[c], errors="coerce") df['Year_Fraction'] = df['Period'].apply(extract_year)# Drop rows where the period couldn't be parsed (e.g. footnotes)return df.dropna(subset=['Year_Fraction']).copy()def parse_neet_sheet(filepath, sheet_name):"""Robustly parses a sheet from the ONS NEET dataset into a clean pandas DataFrame.""" raw = pd.read_excel(filepath, sheet_name=sheet_name, header=None)# Locate where the actual data starts by finding the "Levels" string in the first column header_start = raw.index[raw.iloc[:, 0].astype(str).str.contains("Levels", na=False)][0]# Headers are spread across three rows directly above the data start age_row = raw.iloc[header_start -2] metric_row = raw.iloc[header_start -1] sub_metric_row = raw.iloc[header_start] data_start = header_start +3 df = raw.iloc[data_start:].reset_index(drop=True) columns = [] current_age ="" current_metric =""# Forward-fill logic for the merged header cellsfor age, metric, sub inzip(age_row, metric_row, sub_metric_row):if pd.notna(age) andstr(age).strip() !="": current_age =str(age).strip()if pd.notna(metric) andstr(metric).strip() !="": current_metric =str(metric).strip() parts = [current_age, current_metric, str(sub).strip() if pd.notna(sub) else""] columns.append("_".join(p for p in parts if p and p !='NaN')) df.columns = columns df = df.rename(columns={df.columns[0]: "Period"}) df = df.dropna(how="all", subset=["Period"])# Clean numerical columns and handle '..' missing-data markersfor c in df.columns[1:]: df[c] = df[c].astype(str).str.replace(",", "", regex=False).replace("..", pd.NA).replace("nan", pd.NA) df[c] = pd.to_numeric(df[c], errors="coerce") df['Year_Fraction'] = df['Period'].apply(extract_year) df = df.dropna(subset=['Year_Fraction']).copy()# The NEET dataset begins tracking later than A05, and the early rows for the# 18-24 rate are blank; drop them so charts start from real data. rate_col = find_col(df, "18-24", "NEET as a percentage")return df.dropna(subset=[rate_col]).copy()
# Here you can see all columns we have available to usdfs = [df_people, df_men, df_women, df_neet_people, df_neet_men, df_neet_women]for df in dfs:for column in df.columns:print(column)print("\n\n")
Period
Aged 16 and over_Employment_level_MGRZ
Aged 16 and over_Employment_rate (%)_MGSR
Aged 16 and over_Unemployment_level_MGSC
Aged 16 and over_Unemployment_rate (%)_MGSX
Aged 16 and over_Activity_level_MGSF
Aged 16 and over_Activity_rate (%)_MGWG
Aged 16 and over_Inactivity_level_MGSI
Aged 16 and over_Inactivity_rate (%)_YBTC
Aged 16-64_Employment_level_LF2G
Aged 16-64_Employment_rate (%)_LF24
Aged 16-64_Unemployment_level_LF2I
Aged 16-64_Unemployment_rate (%)_LF2Q
Aged 16-64_Activity_level_LF2K
Aged 16-64_Activity_rate (%)_LF22
Aged 16-64_Inactivity_level_LF2M
Aged 16-64_Inactivity_rate (%)_LF2S
Aged 16-17_Employment_level_YBTO
Aged 16-17_Employment_rate (%)_YBUA
Aged 16-17_Unemployment_level_YBVH
Aged 16-17_Unemployment_rate (%)_YBVK
Aged 16-17_Activity_level_YBZL
Aged 16-17_Activity_rate (%)_YCAG
Aged 16-17_Inactivity_level_YCAS
Aged 16-17_Inactivity_rate (%)_LWEX
Aged 18-24_Employment_level_YBTR
Aged 18-24_Employment_rate (%)_YBUD
Aged 18-24_Unemployment_level_YBVN
Aged 18-24_Unemployment_rate (%)_YBVQ
Aged 18-24_Activity_level_YBZO
Aged 18-24_Activity_rate (%)_YCAJ
Aged 18-24_Inactivity_level_YCAV
Aged 18-24_Inactivity_rate (%)_LWFA
Aged 25-34_Employment_level_YBTU
Aged 25-34_Employment_rate (%)_YBUG
Aged 25-34_Unemployment_level_YCGM
Aged 25-34_Unemployment_rate (%)_YCGP
Aged 25-34_Activity_level_YBZR
Aged 25-34_Activity_rate (%)_YCAM
Aged 25-34_Inactivity_level_YCAY
Aged 25-34_Inactivity_rate (%)_LWFD
Aged 35-49_Employment_level_YBTX
Aged 35-49_Employment_rate (%)_YBUJ
Aged 35-49_Unemployment_level_YCGS
Aged 35-49_Unemployment_rate (%)_YCGV
Aged 35-49_Activity_level_YBZU
Aged 35-49_Activity_rate (%)_YCAP
Aged 35-49_Inactivity_level_YCBB
Aged 35-49_Inactivity_rate (%)_LWFG
Aged 50-64_Employment_level_LF26
Aged 50-64_Employment_rate (%)_LF2U
Aged 50-64_Unemployment_level_LF28
Aged 50-64_Unemployment_rate (%)_LF2E
Aged 50-64_Activity_level_LF3A
Aged 50-64_Activity_rate (%)_LF2C
Aged 50-64_Inactivity_level_LF2A
Aged 50-64_Inactivity_rate (%)_LF2W
Age 65+_Employment_level_LFK4
Age 65+_Employment_rate (%)_LFK6
Age 65+_Unemployment_level_K5HU
Age 65+_Unemployment_rate (%)_K5HW
Age 65+_Activity_level_LFK8
Age 65+_Activity_rate (%)_LFL2
Age 65+_Inactivity_level_LFL4
Age 65+_Inactivity_rate (%)_LFL6
Year_Fraction


Period
Aged 16 and over_Employment_level_MGSA
Aged 16 and over_Employment_rate (%)_MGSS
Aged 16 and over_Unemployment_level_MGSD
Aged 16 and over_Unemployment_rate (%)_MGSY
Aged 16 and over_Activity_level_MGSG
Aged 16 and over_Activity_rate (%)_MGWH
Aged 16 and over_Inactivity_level_MGSJ
Aged 16 and over_Inactivity_rate (%)_YBTD
Aged 16-64_Employment_level_YBSF
Aged 16-64_Employment_rate (%)_MGSV
Aged 16-64_Unemployment_level_YBSI
Aged 16-64_Unemployment_rate (%)_YBTJ
Aged 16-64_Activity_level_YBSL
Aged 16-64_Activity_rate (%)_MGSP
Aged 16-64_Inactivity_level_YBSO
Aged 16-64_Inactivity_rate (%)_YBTM
Aged 16-17_Employment_level_YBTP
Aged 16-17_Employment_rate (%)_YBUB
Aged 16-17_Unemployment_level_YBVI
Aged 16-17_Unemployment_rate (%)_YBVL
Aged 16-17_Activity_level_YBZM
Aged 16-17_Activity_rate (%)_YCAH
Aged 16-17_Inactivity_level_YCAT
Aged 16-17_Inactivity_rate (%)_LWEY
Aged 18-24_Employment_level_YBTS
Aged 18-24_Employment_rate (%)_YBUE
Aged 18-24_Unemployment_level_YBVO
Aged 18-24_Unemployment_rate (%)_YBVR
Aged 18-24_Activity_level_YBZP
Aged 18-24_Activity_rate (%)_YCAK
Aged 18-24_Inactivity_level_YCAW
Aged 18-24_Inactivity_rate (%)_LWFB
Aged 25-34_Employment_level_YBTV
Aged 25-34_Employment_rate (%)_YBUH
Aged 25-34_Unemployment_level_YCGN
Aged 25-34_Unemployment_rate (%)_YCGQ
Aged 25-34_Activity_level_YBZS
Aged 25-34_Activity_rate (%)_YCAN
Aged 25-34_Inactivity_level_YCAZ
Aged 25-34_Inactivity_rate (%)_LWFE
Aged 35-49_Employment_level_YBTY
Aged 35-49_Employment_rate (%)_YBUK
Aged 35-49_Unemployment_level_YCGT
Aged 35-49_Unemployment_rate (%)_YCGW
Aged 35-49_Activity_level_YBZV
Aged 35-49_Activity_rate (%)_YCAQ
Aged 35-49_Inactivity_level_YCBC
Aged 35-49_Inactivity_rate (%)_LWFH
Aged 50-64_Employment_level_MGUX
Aged 50-64_Employment_rate (%)_YBUN
Aged 50-64_Unemployment_level_MGVM
Aged 50-64_Unemployment_rate (%)_MGXF
Aged 50-64_Activity_level_YBZY
Aged 50-64_Activity_rate (%)_MGWQ
Aged 50-64_Inactivity_level_MGWB
Aged 50-64_Inactivity_rate (%)_LWFK
Age 65+_Employment_level_MGVA
Age 65+_Employment_rate (%)_YBUQ
Age 65+_Unemployment_level_MGVP
Age 65+_Unemployment_rate (%)_MGXI
Age 65+_Activity_level_YCAE
Age 65+_Activity_rate (%)_MGWT
Age 65+_Inactivity_level_MGWE
Age 65+_Inactivity_rate (%)_LWFN
Year_Fraction


Period
Aged 16 and over_Employment_level_MGSB
Aged 16 and over_Employment_rate (%)_MGST
Aged 16 and over_Unemployment_level_MGSE
Aged 16 and over_Unemployment_rate (%)_MGSZ
Aged 16 and over_Activity_level_MGSH
Aged 16 and over_Activity_rate (%)_MGWI
Aged 16 and over_Inactivity_level_MGSK
Aged 16 and over_Inactivity_rate (%)_YBTE
Aged 16-64_Employment_level_LF2H
Aged 16-64_Employment_rate (%)_LF25
Aged 16-64_Unemployment_level_LF2J
Aged 16-64_Unemployment_rate (%)_LF2R
Aged 16-64_Activity_level_LF2L
Aged 16-64_Activity_rate (%)_LF23
Aged 16-64_Inactivity_level_LF2N
Aged 16-64_Inactivity_rate (%)_LF2T
Aged 16-17_Employment_level_YBTQ
Aged 16-17_Employment_rate (%)_YBUC
Aged 16-17_Unemployment_level_YBVJ
Aged 16-17_Unemployment_rate (%)_YBVM
Aged 16-17_Activity_level_YBZN
Aged 16-17_Activity_rate (%)_YCAI
Aged 16-17_Inactivity_level_YCAU
Aged 16-17_Inactivity_rate (%)_LWEZ
Aged 18-24_Employment_level_YBTT
Aged 18-24_Employment_rate (%)_YBUF
Aged 18-24_Unemployment_level_YBVP
Aged 18-24_Unemployment_rate (%)_YBVS
Aged 18-24_Activity_level_YBZQ
Aged 18-24_Activity_rate (%)_YCAL
Aged 18-24_Inactivity_level_YCAX
Aged 18-24_Inactivity_rate (%)_LWFC
Aged 25-34_Employment_level_YBTW
Aged 25-34_Employment_rate (%)_YBUI
Aged 25-34_Unemployment_level_YCGO
Aged 25-34_Unemployment_rate (%)_YCGR
Aged 25-34_Activity_level_YBZT
Aged 25-34_Activity_rate (%)_YCAO
Aged 25-34_Inactivity_level_YCBA
Aged 25-34_Inactivity_rate (%)_LWFF
Aged 35-49_Employment_level_YBTZ
Aged 35-49_Employment_rate (%)_YBUL
Aged 35-49_Unemployment_level_YCGU
Aged 35-49_Unemployment_rate (%)_YCGX
Aged 35-49_Activity_level_YBZW
Aged 35-49_Activity_rate (%)_YCAR
Aged 35-49_Inactivity_level_YCBD
Aged 35-49_Inactivity_rate (%)_LWFI
Aged 50-64_Employment_level_LF27
Aged 50-64_Employment_rate (%)_LF2V
Aged 50-64_Unemployment_level_LF29
Aged 50-64_Unemployment_rate (%)_LF2F
Aged 50-64_Activity_level_LF3B
Aged 50-64_Activity_rate (%)_LF2D
Aged 50-64_Inactivity_level_LF2B
Aged 50-64_Inactivity_rate (%)_LF2X
Age 65+_Employment_level_LFK5
Age 65+_Employment_rate (%)_LFK7
Age 65+_Unemployment_level_K5HV
Age 65+_Unemployment_rate (%)_K5HX
Age 65+_Activity_level_LFK9
Age 65+_Activity_rate (%)_LFL3
Age 65+_Inactivity_level_LFL5
Age 65+_Inactivity_rate (%)_LFL7
Year_Fraction


Period
Aged 16-24_Young people who were NEET_Total
Aged 16-24_Young people who were NEET_Unemployed
Aged 16-24_Young people who were NEET_Economically inactive
Aged 16-24_Total people in relevant population group
Aged 16-24_People who were NEET as a percentage of people in relevant population group
Aged 16-17_Young people who were NEET_Total
Aged 16-17_Young people who were NEET_Unemployed
Aged 16-17_Young people who were NEET_Economically inactive
Aged 16-17_Total people in relevant population group
Aged 16-17_People who were NEET as a percentage of people in relevant population group
Aged 18-24_Young people who were NEET_Total
Aged 18-24_Young people who were NEET_Unemployed
Aged 18-24_Young people who were NEET_Economically inactive
Aged 18-24_Total people in relevant population group
Aged 18-24_People who were NEET as a percentage of people in relevant population group
Year_Fraction


Period
Aged 16-24_Young people who were NEET_Total
Aged 16-24_Young people who were NEET_Unemployed
Aged 16-24_Young people who were NEET_Economically inactive
Aged 16-24_Total people in relevant population group
Aged 16-24_People who were NEET as a percentage of people in relevant population group
Aged 16-17_Young people who were NEET_Total
Aged 16-17_Young people who were NEET_Unemployed
Aged 16-17_Young people who were NEET_Economically inactive
Aged 16-17_Total people in relevant population group
Aged 16-17_People who were NEET as a percentage of people in relevant population group
Aged 18-24_Young people who were NEET_Total
Aged 18-24_Young people who were NEET_Unemployed
Aged 18-24_Young people who were NEET_Economically inactive
Aged 18-24_Total people in relevant population group
Aged 18-24_People who were NEET as a percentage of people in relevant population group
Year_Fraction


Period
Aged 16-24_Young people who were NEET_Total
Aged 16-24_Young people who were NEET_Unemployed
Aged 16-24_Young people who were NEET_Economically inactive
Aged 16-24_Total people in relevant population group
Aged 16-24_People who were NEET as a percentage of people in relevant population group
Aged 16-17_Young people who were NEET_Total
Aged 16-17_Young people who were NEET_Unemployed
Aged 16-17_Young people who were NEET_Economically inactive
Aged 16-17_Total people in relevant population group
Aged 16-17_People who were NEET as a percentage of people in relevant population group
Aged 18-24_Young people who were NEET_Total
Aged 18-24_Young people who were NEET_Unemployed
Aged 18-24_Young people who were NEET_Economically inactive
Aged 18-24_Total people in relevant population group
Aged 18-24_People who were NEET as a percentage of people in relevant population group
Year_Fraction
Graphs
Here are some graphs that show how levels of employment and economic activity varied between men and women in the age group 18 to 24, and the associated trends over time.
Key points include the drop in employments around [2008], recent trends in levels of NEET in the age group
Show code
def line_trace(x, y, name, color, width=2, dash=None):"""Builds a single styled Plotly line trace."""return go.Scatter(x=x, y=y, mode='lines', name=name, line=dict(color=color, width=width, dash=dash))def style_figure(fig, title, yaxis_title, xaxis_title='Year', height=550, width=None, yaxis_range=None, legend=None):"""Applies the shared layout styling used by every line chart in this notebook.""" layout =dict( title=title, xaxis_title=xaxis_title, yaxis_title=yaxis_title, template='plotly_white', hovermode='x unified', height=height, ) layout['yaxis'] =dict(range=yaxis_range) if yaxis_range elsedict(autorange=True)if width: layout['width'] = widthif legend: layout['legend'] = legend fig.update_layout(**layout)return fig
Employment and inactivity, by gender
First, how do employment and inactivity rates for 18-24 year olds compare between men and women?
Show code
col_men_emp = find_col(df_men, "Aged 18-24", "Employment_rate")col_men_inac = find_col(df_men, "Aged 18-24", "Inactivity_rate")col_women_emp = find_col(df_women, "Aged 18-24", "Employment_rate")col_women_inac = find_col(df_women, "Aged 18-24", "Inactivity_rate")# Employment: Men vs Womenfig_emp = go.Figure(data=[ line_trace(df_men['Year_Fraction'], df_men[col_men_emp], 'Men (18-24)', '#1f77b4'), line_trace(df_women['Year_Fraction'], df_women[col_women_emp], 'Women (18-24)', '#e377c2'),])style_figure(fig_emp, 'Employment Rates for 18-24 Year Olds: Men vs Women','Employment Rate (%)', yaxis_range=[0, 100], width=800)fig_emp.show()# Inactivity: Men vs Womenfig_inac = go.Figure(data=[ line_trace(df_men['Year_Fraction'], df_men[col_men_inac], 'Men (18-24)', '#1f77b4'), line_trace(df_women['Year_Fraction'], df_women[col_women_inac], 'Women (18-24)', '#e377c2'),])style_figure(fig_inac, 'Inactivity Rates for 18-24 Year Olds: Men vs Women','Inactivity Rate (%)', yaxis_range=[0, 100], width=800)fig_inac.show()
NEET rates
Next, the headline NEET (Not in Education, Employment or Training) rate for 18-24 year olds over time.
Show code
col_neet_1824 = find_col(df_neet_people, "18-24", "NEET as a percentage")fig_neet_overall = go.Figure(data=[ line_trace(df_neet_people['Year_Fraction'], df_neet_people[col_neet_1824],'Aged 18-24 NEET Rate', '#d62728', width=2.5)])style_figure(fig_neet_overall, 'Overall NEET Rates in the UK (Seasonally Adjusted)', 'NEET Rate (%)')fig_neet_overall.show()
And the same NEET rate split out by gender.
Show code
fig_neet_gender = go.Figure(data=[ line_trace(df_neet_men['Year_Fraction'], df_neet_men[col_neet_1824], 'Men (18-24) NEET Rate', '#1f77b4'), line_trace(df_neet_women['Year_Fraction'], df_neet_women[col_neet_1824], 'Women (18-24) NEET Rate', '#e377c2'),])style_figure(fig_neet_gender, 'NEET Rates for 18-24 Year Olds: Men vs Women', 'NEET Rate (%)')fig_neet_gender.show()
I think the NEET rate going down for young women during the 2010s is really interesting. It could be the result of female inclusion in education, lower rates of young parernthood allowing people to enter the workforce, post-financial crisis work necessity. Unsure.
Clearly NEET rates have risen post-COVID, during a Cost-of-Living Crisis, paired with a difficult job search market.
I should compare employment rates / new employees taken on by skilled vs unskilled sectors. It might show that this is a skills gap issue, as we see in many in-demand tech roles.
The “NEET Gap”: what if these young people were employed instead?
To make the NEET rate concrete, this chart merges the employment and NEET datasets and models two hypothetical scenarios on top of the actual employment rate: what employment would look like if the NEET rate were halved, and what it would look like if it were eliminated entirely (i.e. every NEET became employed).
Finally, a snapshot pie chart breaking the most recent quarter’s 18-24 population down into: employed, in full-time education (economically inactive but not NEET), NEET-and-inactive, and NEET-and-unemployed.
Show code
latest_emp = df_people.iloc[-1][col_emp_1824]pop_col = find_col(df_neet_people, "18-24", "Total people in relevant population group")unemp_col = find_col(df_neet_people, "18-24", "Unemployed")inact_col = find_col(df_neet_people, "18-24", "Economically inactive")df_neet_people['Unemployed_NEET_Rate'] = (df_neet_people[unemp_col] / df_neet_people[pop_col]) *100df_neet_people['Inactive_NEET_Rate'] = (df_neet_people[inact_col] / df_neet_people[pop_col]) *100latest_neet = df_neet_people.iloc[-1]unemp_neet = latest_neet['Unemployed_NEET_Rate']inact_neet = latest_neet['Inactive_NEET_Rate']# The remaining share is assumed to be in full-time education (inactive, non-NEET)inact_students =100- latest_emp - (unemp_neet + inact_neet)labels = ['Employed', 'Full-Time Education (Inactive)', 'NEET (Economically Inactive)', 'NEET (Unemployed)']values = [latest_emp, inact_students, inact_neet, unemp_neet]colors = ['#2ca02c', '#1f77b4', '#9467bd', '#d62728']fig_pie = go.Figure(data=[go.Pie( labels=labels, values=values, pull=[0, 0, 0.1, 0.1], # explode the NEET slices slightly for emphasis marker=dict(colors=colors, line=dict(color='#000000', width=1)), textinfo='percent+label', textposition='outside',)])fig_pie.update_layout( title_text='UK Youth (18-24) Economic Status Breakdown (Latest Data)', height=600, showlegend=False,)fig_pie.show()